Data Volume Profiling
Learn how to analyse data growth and volume trends over time using Autonify's Data Volume agent. Track how your data sources are growing or reducing to manage change effectively.
📹 Tracking Data Volume Over Time
Discover how to monitor data growth, view volume trends, and track row counts across your databases.
Understanding Data Volume Profiling
The Data Volume agent tracks and analyses how your data is evolving over time:
- Row Count Tracking: Monitors total rows across all tables
- Growth Trends: Shows how data volume changes over time
- Table-Level Metrics: Individual table row counts
- Historical Analysis: Maintains complete volume history
Why Track Data Volume?
Data volume profiling helps you:
- Monitor Growth: Understand how quickly data is accumulating
- Capacity Planning: Anticipate storage and performance needs
- Identify Anomalies: Detect unexpected data growth or loss
- Performance Optimisation: Correlate volume with performance issues
- Cost Management: Track storage costs as data grows
Viewing Data Volume
Dashboard Widget
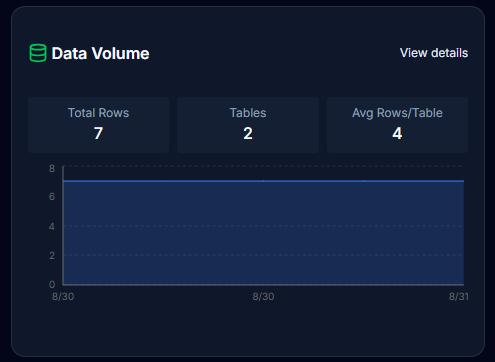
When you open a data source, the Data Volume widget displays key metrics at a glance:
- Total Rows: The complete count across all tables
- Tables: Number of tables being tracked
- Average Rows per Table: Calculated average for quick assessment
- Trend Chart: Visual representation of how your data is growing over time

The widget provides instant insights into your data growth patterns. If no data is available, you'll see a prompt to run the data volume analysis.
Accessing Volume Data
There are two primary ways to view volume data:
Method 1: Through the Data Catalog
- Navigate to Data Catalog in the sidebar
- Browse to your desired table
- Row counts are displayed in the table list:
- Rows column shows current count
- Updated after each volume profiling run
- Click on a table to view details
- Select the Volume tab

Method 2: Data Volume Agent View
- From the data source dashboard, click "View details" on the Data Volume widget OR
- Navigate to Agents → click View on Data Volume agent card
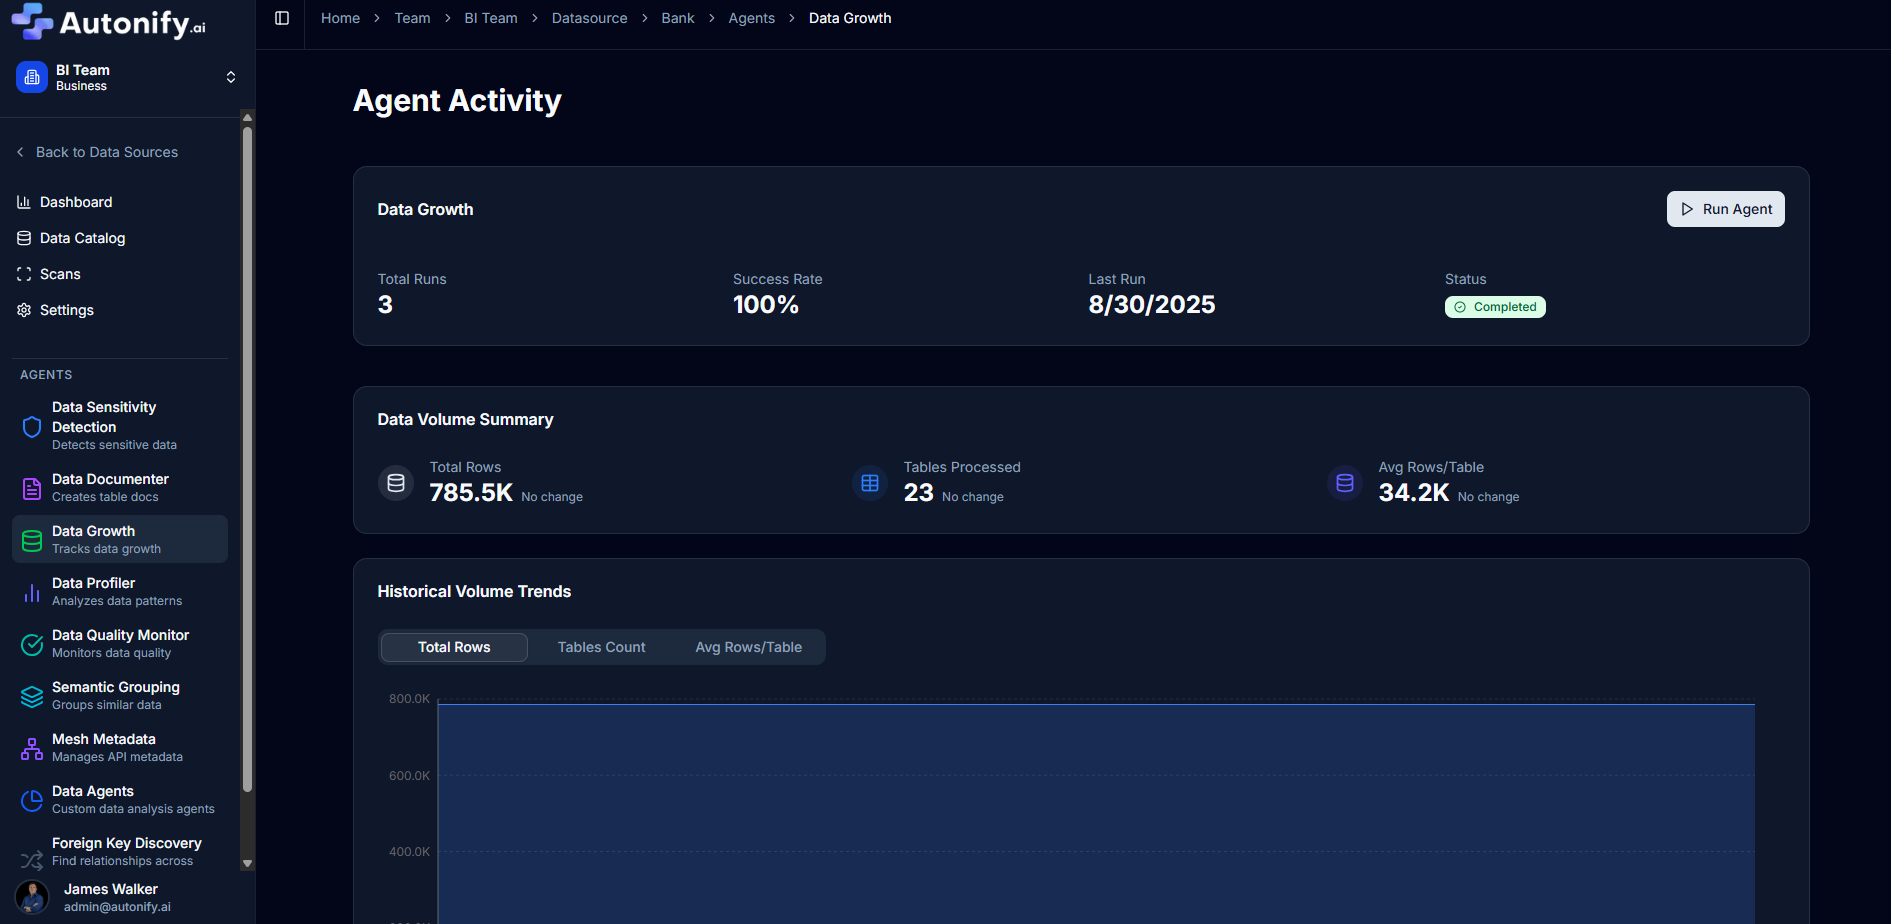
- Opens the Agent Activity page with:
- Agent statistics card
- Data Volume dashboard below

Volume Tab Features
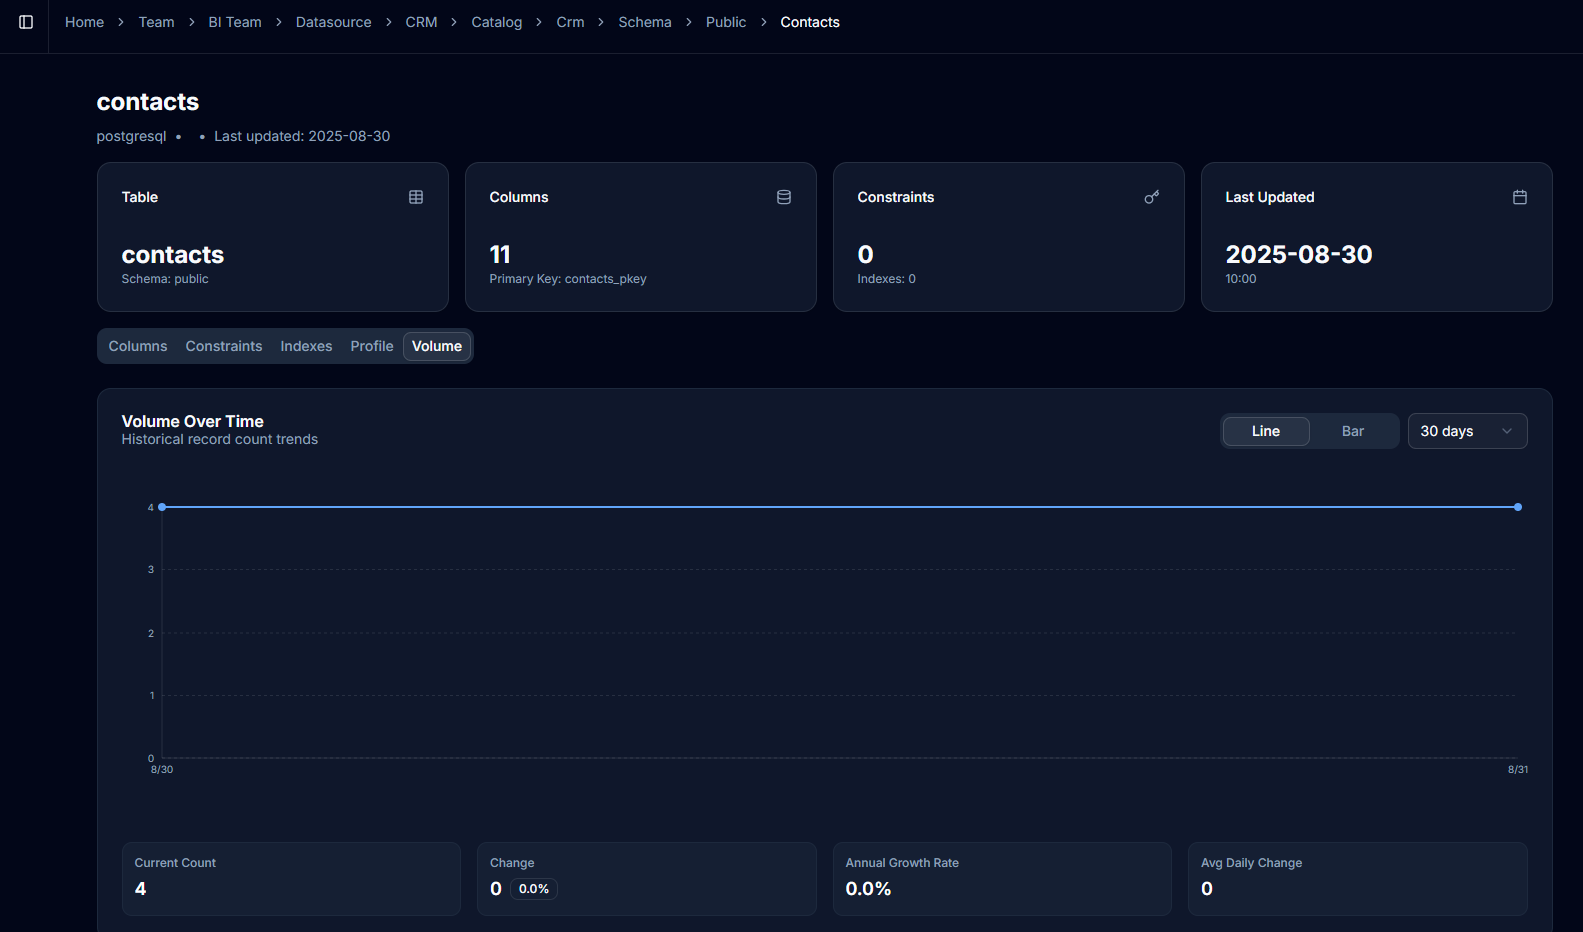
When viewing a specific table's Volume tab:
Volume Overview
The Volume tab presents historical record count trends for the selected table, helping you understand how individual tables grow over time.
Chart Controls
Customise your view with flexible display options:
- Chart Type: Choose between line or bar charts
- Time Range: Select from 7 days, 30 days, 90 days, or 1 year views
Metrics Displayed
- Current Row Count: Latest recorded count
- Growth Rate: Annual growth percentage
- Peak Count: Maximum rows recorded
- Average Growth: Daily/weekly averages
Chart Display
The volume chart shows your data trends over time with interactive tooltips for detailed information. If volume data hasn't been collected yet, you'll see a message indicating that data will appear after multiple scans have been completed.
Data Volume Agent Dashboard
The Data Volume agent view provides:
Data Volume Summary Card
The summary card presents your current data metrics with clear change indicators:
- Total Rows: Shows your current total with growth or decline percentage
- Tables Processed: Number of tables being monitored
- Average Rows per Table: Helps identify table size distribution
Visual indicators help you quickly understand trends - growth appears in green, declines in red, and unchanged metrics in grey.
Historical Volume Trends Card
Explore your data history through different perspectives:
- Total Rows: Track overall data growth
- Tables Count: Monitor database expansion
- Average Rows per Table: Understand data distribution
The interactive chart displays your complete historical data with tooltips showing exact values for any point in time.
Data Availability
When data isn't available, you'll receive clear guidance:
- If no data has been collected, you'll see a prompt to run the Data Volume agent
- During data loading, a progress indicator keeps you informed
- If an error occurs, you'll see a clear message explaining the issue
Running the Agent
Manual Execution
To run the Data Volume agent:
- Navigate to the Agent Activity page
- Click the Run Agent button to start profiling
- The agent will begin collecting volume metrics
- You can cancel the operation if needed while it's running

What Happens During Profiling
The agent:
- Queries each table's row count
- Records timestamp of collection
- Calculates growth since last run
- Stores data for historical tracking
- Updates dashboard widgets
Execution Time
Profiling duration depends on:
- Number of tables
- Database performance
- Network latency
- Query complexity
Typically completes in seconds to minutes.
Understanding the Data
Static vs Growing Data
-
Static Data: Row count remains constant
- Indicates no new records added
- Common for reference tables
- Chart shows flat line
-
Growing Data: Increasing row counts
- Shows upward trend
- Normal for transactional tables
- Monitor growth rate
-
Declining Data: Decreasing counts
- May indicate data archival
- Could signal deletion processes
- Investigate unexpected drops
Growth Patterns
Common patterns you might observe:
Linear Growth
- Steady, consistent increase
- Predictable capacity needs
- Regular business activity
Exponential Growth
- Accelerating increase
- May require intervention
- Check for runaway processes
Periodic Spikes
- Regular peaks and valleys
- Often batch processing
- Seasonal variations
Plateau
- Growth levels off
- Reached steady state
- May indicate limits
Best Practices
Regular Monitoring
- Run agent daily for active databases
- Weekly for stable systems
- After major data operations
Setting Baselines
- Establish normal growth rates
- Document expected patterns
- Create alerts for anomalies
Capacity Planning
- Use trends for forecasting
- Plan storage expansion
- Optimise before limits
Performance Correlation
- Compare volume with query performance
- Identify size-related issues
- Plan maintenance windows
Use Cases
Development Environments
- Track test data accumulation
- Monitor data generation scripts
- Ensure cleanup processes work
Production Monitoring
- Watch for unexpected growth
- Validate archival processes
- Capacity planning
Data Migration
- Compare source/target volumes
- Verify complete transfers
- Track incremental loads
Compliance and Auditing
- Document data retention
- Prove deletion compliance
- Historical growth records
Interpreting Results
Healthy Patterns
- Predictable growth rates
- Consistent with business activity
- Within capacity limits
Warning Signs
- Sudden unexplained growth
- Dramatic drops in volume
- Tables growing at different rates than expected
- Approaching storage limits
Action Items
When you see concerning patterns:
- Investigate root cause
- Check for process changes
- Verify data integrity
- Plan remediation
Integration with Other Features
Data Catalog
- Row counts visible in table lists
- Quick volume assessment
- Navigate to detailed views
Scan History
- Volume updates after scans
- Correlate schema changes with volume
- Track growth alongside structure
Other Agents
- Combine with Data Profiler for completeness
- Use with Quality Monitor for validation
- Reference for synthetic data generation
Limitations
Sampling
- Large tables may use estimates
- Exact counts for smaller tables
- Database-specific counting methods
Frequency
- Point-in-time snapshots
- Not real-time monitoring
- Requires manual or scheduled runs
Scope
- Row counts only (not data size in bytes)
- Table-level granularity
- No column-level metrics
Next Steps
After understanding data volume: