Data Catalog Overview
Learn how to navigate and explore your discovered metadata through Autonify's data catalog. The catalog provides a hierarchical view of your databases, schemas, tables, and columns with comprehensive metadata tracking.
📹 Navigating the Data Catalog
Discover how to explore your data catalog, navigate through databases and schemas, and access discovered metadata.
Understanding the Data Catalog
The data catalog is your central repository for exploring and managing discovered metadata:
- Hierarchical Organisation: Navigate from databases to schemas to tables to columns
- Metadata Discovery: Automatically collected information about your data structure
- Search Capabilities: Quickly find specific databases, schemas, or tables
- Agent Integration: View results from all connected AI agents
Accessing the Data Catalog
From Team Dashboard
- Navigate to your team from the main dashboard
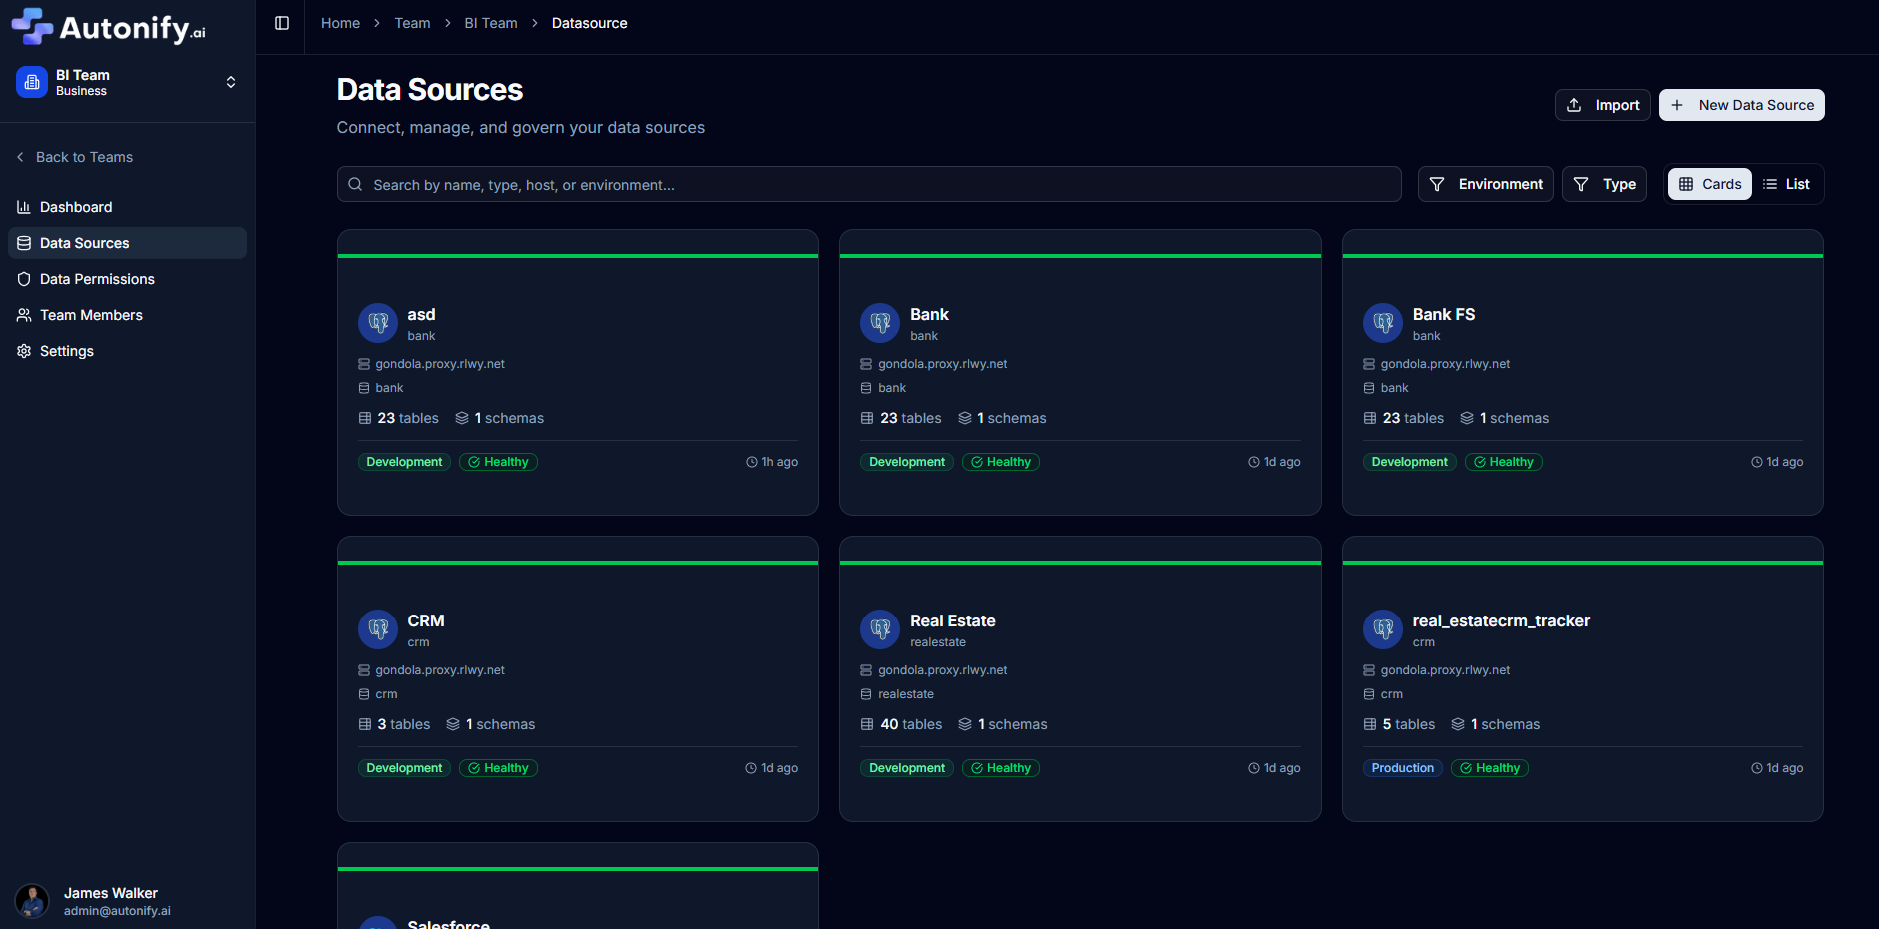
- View all data sources available to your team
- Click on a data source to open its dashboard

Data Source Dashboard
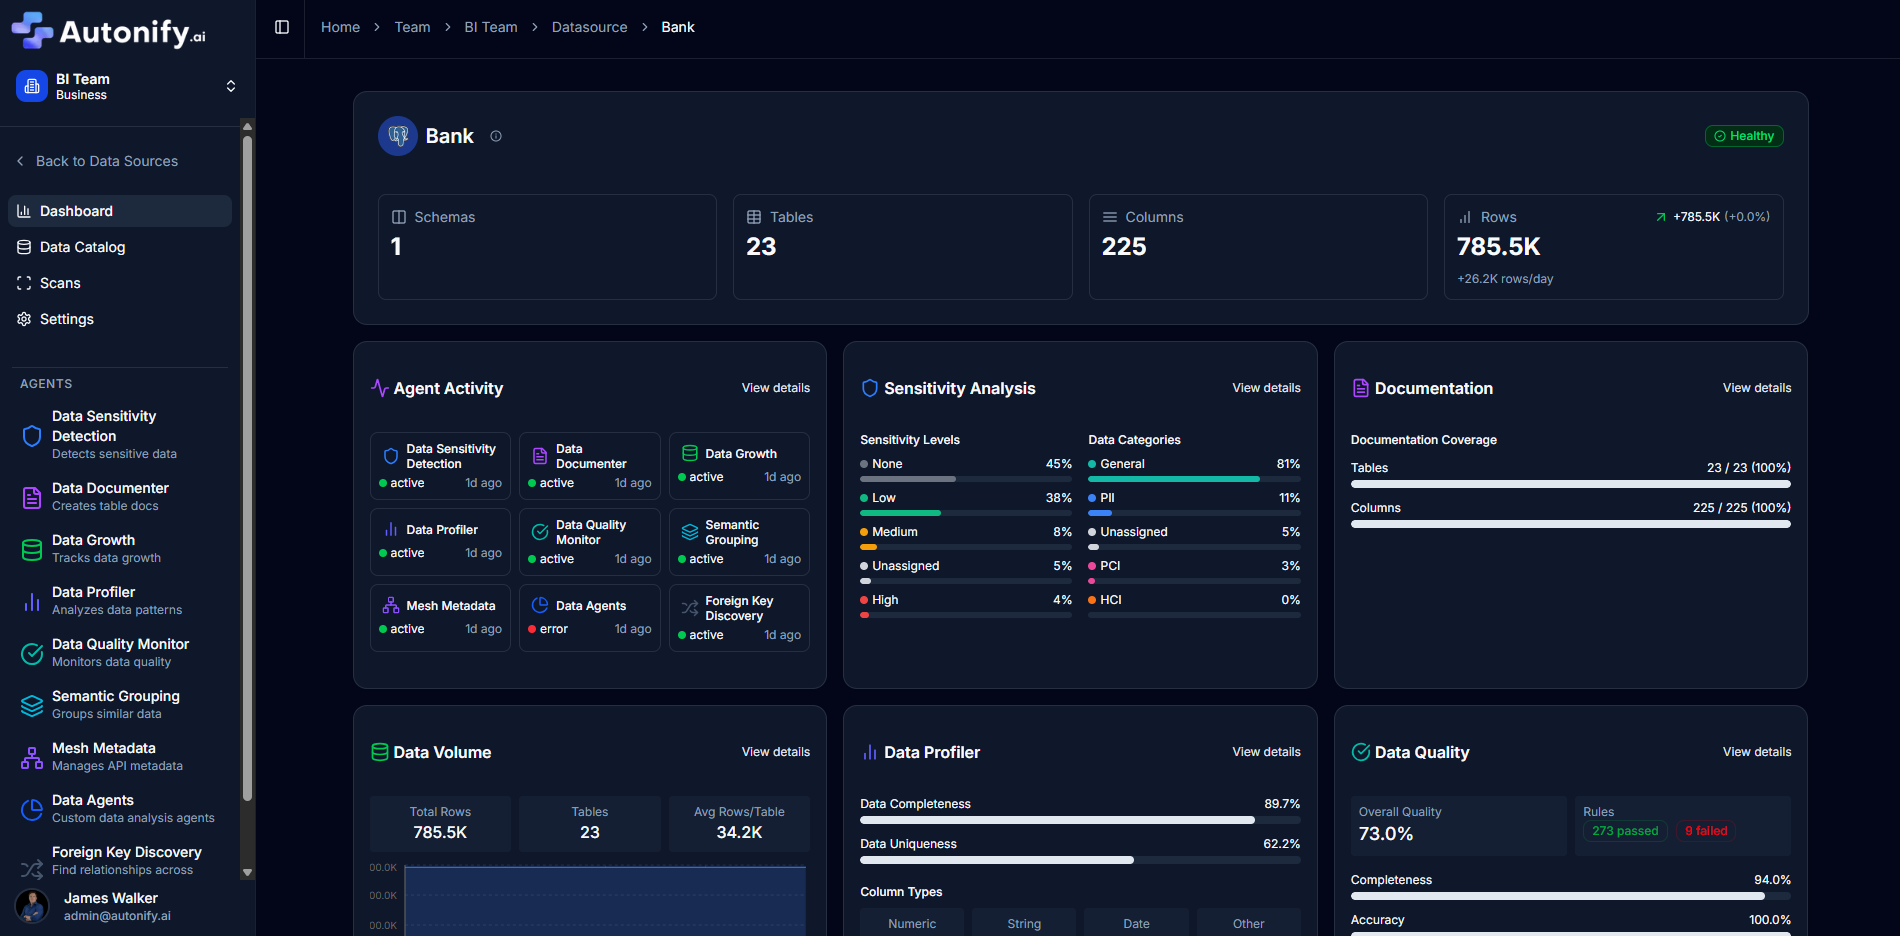
When you first open a data source, the dashboard displays:
- Data Source Summary: Card showing:
- Data source name with database logo
- Status badge (Healthy/Degraded/Unhealthy)
- Schemas, Tables, Columns, and Rows counts
- Growth indicators for each metric
- Active Agents Overview: List of configured agents with their status
- Agent Widgets: Individual cards for each active agent showing specific metrics
Agent widgets vary based on configured agents and may include:
- Data Volume: Storage and growth trends
- Data Profiling: Completeness and uniqueness metrics
- Documentation: Coverage statistics
- Sensitivity Classifier: Data classification summary

Navigating the Catalog
Navigation Menu
From the data source, the sidebar menu includes:
- Dashboard: Overview and agent widgets
- Data Catalog: Browse databases, schemas, and tables
- Scans: View scan history and changes
- Settings: Configure data source (Admin/Owner only)
Catalog Structure
The catalog follows a hierarchical structure:
Data Source
├── Databases
│   ├── Schemas
│   │   ├── Tables
│   │   │   ├── Columns
│   │   │   ├── Constraints
│   │   │   └── Indexes
Database Level
Access the catalog:
- Click Data Catalog in the sidebar menu
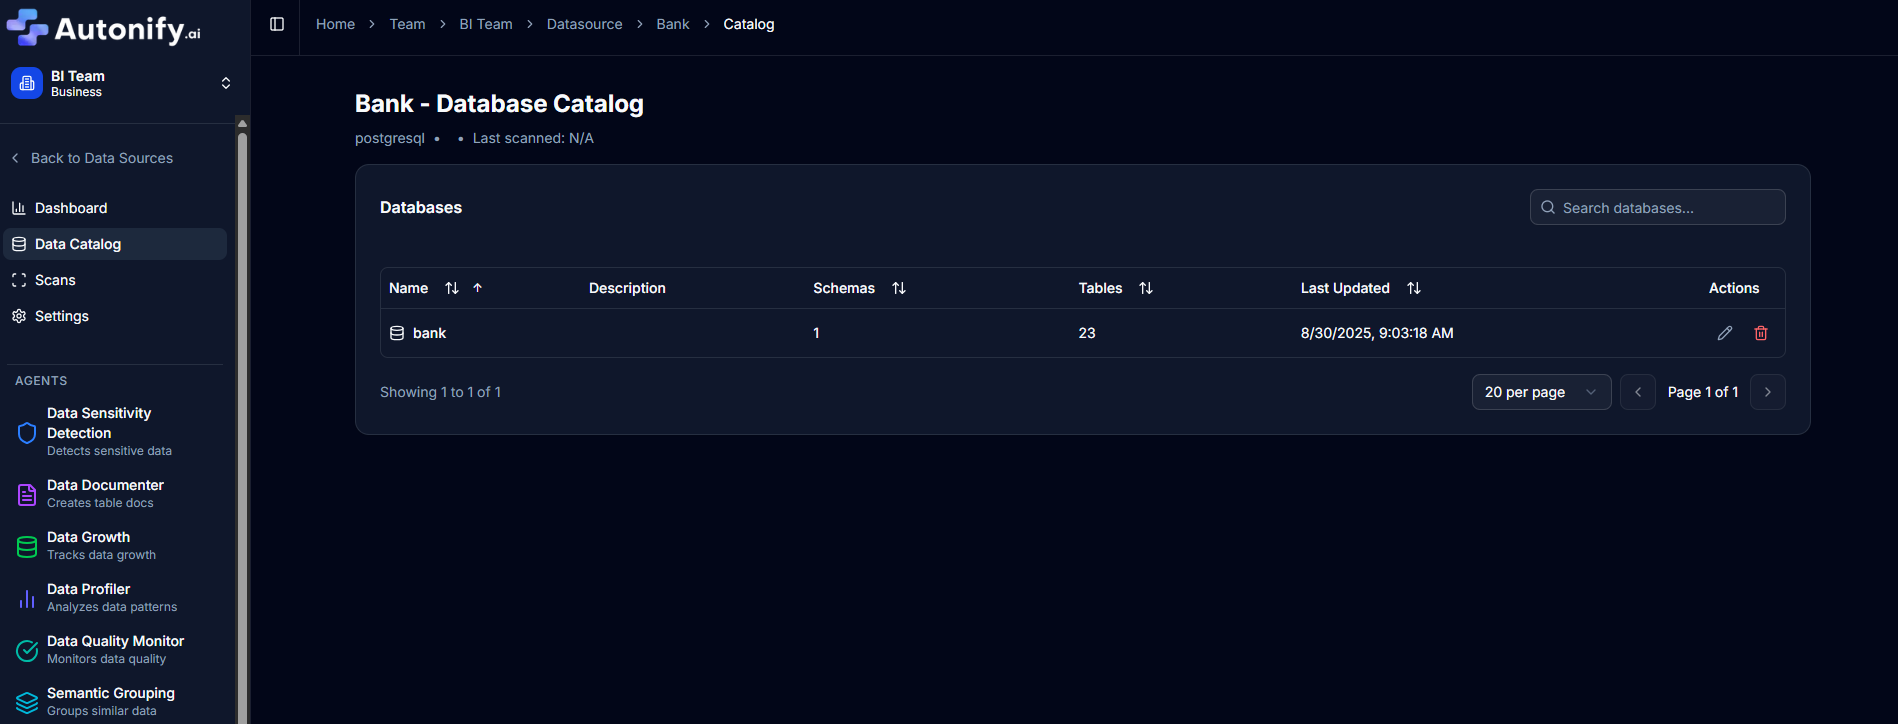
- The database catalog page displays:
- Page title: "[Data Source Name] - Database Catalog"
- Data source type and host
- Last scanned timestamp
- Browse the list of databases with pagination
- Use the search bar to filter databases
- Click on a database name to view its schemas

Schema Level
Click on a database name to view its schemas:
- Page title: "[Database Name] - Schemas"
- List of schemas in a card with table showing:
- Schema name (clickable)
- Description
- Tables count
- Views count
- Functions count
- Last updated timestamp
- Search bar to filter schemas
- Pagination controls
- Sortable columns

Table Level
Click on a schema name to view its tables:
- Page title: "Tables"
- Card containing table with columns:
- Name: Table name (clickable link)
- Rows: Record count (right-aligned, sortable)
- Columns: Column count (right-aligned, sortable)
- Sensitivity: Classification badge (sortable)
- Last Updated: Timestamp (sortable)
- Actions: Edit (pencil icon) and Delete (trash icon) buttons
- Search bar with placeholder "Search tables..."
- Pagination controls at the bottom
- Click table name to view details

Table Details Page
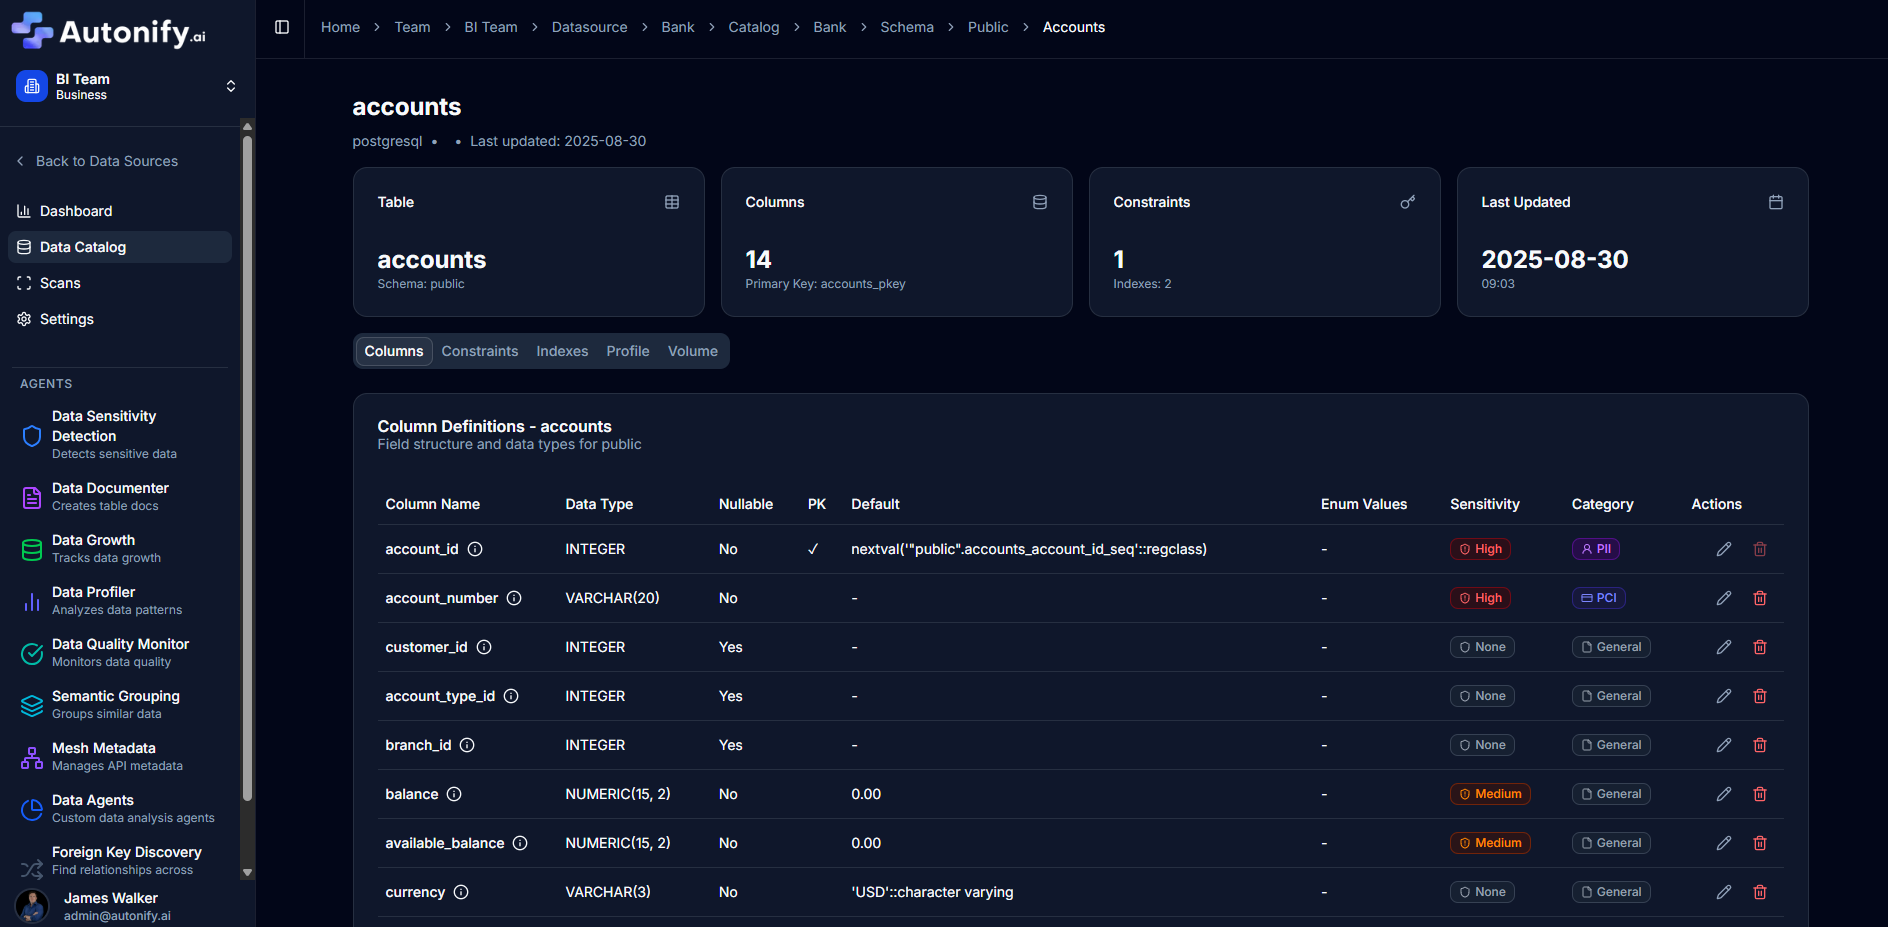
Click on a table name to view comprehensive information:

Tabs Available:
- Columns: List of all columns with:
- Column name
- Data type
- Nullable indicator
- Primary key badge
- Foreign key badge
- Default value
- Sensitivity classification
- Description
- Edit button for each column
- Constraints: Primary keys, foreign keys, unique, and check constraints
- Indexes: Database indexes on the table
- Profile: Data profiling metrics if available
- Volume: Historical data volume charts if available
Key Features
Search Functionality
Each level of the catalog includes search:
- Database Search: Filter databases by name
- Schema Search: Find schemas within a database
- Table Search: Locate specific tables in a schema
- Column Search: Search within table columns
Metadata Editing
Edit metadata through dedicated dialogs:
Table Edit Dialog:
- Basic Tab:
- Table name (required)
- Description (optional)
- Classification Tab:
- Sensitivity level dropdown (High/Medium/Low/None/Unassigned)
- Sensitivity reason (shown when classified)
Column Edit Dialog:
- Column name
- Description
- Sensitivity classification
- Data category
All edits are saved immediately and reflected in the catalog.
Agent Integration
View results from all active agents:
- Data Volume: Historical size and growth trends
- Data Profiling: Completeness and uniqueness metrics
- Documentation: AI-generated descriptions
- Sensitivity: PII and compliance classifications
- Quality Rules: Data validation results
Understanding Table Metrics
Each table displays key metrics:
Row Count
- Total number of records
- Updated after each scan
- Helps identify table size and growth
Column Count
- Number of columns in the table
- Includes all column types
- Quick indicator of table complexity
Sensitivity Status
- Classification level (High, Medium, Low, None)
- Based on sensitivity analysis agent
- Critical for compliance and security
Last Tracked
- Timestamp of most recent scan
- Indicates data freshness
- Helps track update frequency
Navigation Tips
Hierarchical Navigation
- Click through each level: Database → Schema → Table → Columns
- Each level shows relevant metadata
- Use browser back button to return
Quick Actions
- Click table names to view column details
- Use edit buttons to update metadata
- Delete tables with confirmation dialog
Search and Sort
- Search boxes at each catalog level
- Click column headers to sort
- Pagination controls for large lists
Best Practices
Regular Exploration
- Review catalog after each scan
- Check for new tables and schemas
- Verify metadata accuracy
Metadata Maintenance
- Add business descriptions
- Document data ownership
- Tag critical tables
Agent Utilisation
- Enable relevant agents for your needs
- Review agent findings regularly
- Act on agent recommendations
Common Use Cases
Data Discovery
- Find specific tables quickly
- Understand table relationships
- Identify data sources
Impact Analysis
- Assess schema changes
- Track table dependencies
- Plan migrations
Compliance Review
- Identify sensitive data
- Track PII locations
- Ensure data governance
Documentation
- Access auto-generated descriptions
- Add business context
- Share knowledge with team
Next Steps
After exploring the catalog overview: