Managing Data Sources
Learn how to manage data sources within teams. Data sources connect teams to specific databases using existing connectors, allowing you to control permissions, access levels, and run AI agents to extract metadata.
📹 Data Source Management
Learn how to add data sources to teams, configure scanning options, and manage agents for metadata extraction.
Understanding Data Sources
Data sources bridge the gap between connectors and teams:
- Connectors: Define the connection to external systems
- Data Sources: Use connectors within specific teams
- Team Isolation: Each team manages its own data sources
- Agent Configuration: Select which AI agents to run on each data source
Creating a Data Source
Step 1: Navigate to Team
- Go to the Teams section
- Select the team where you want to add the data source
- Navigate to the Data Sources tab
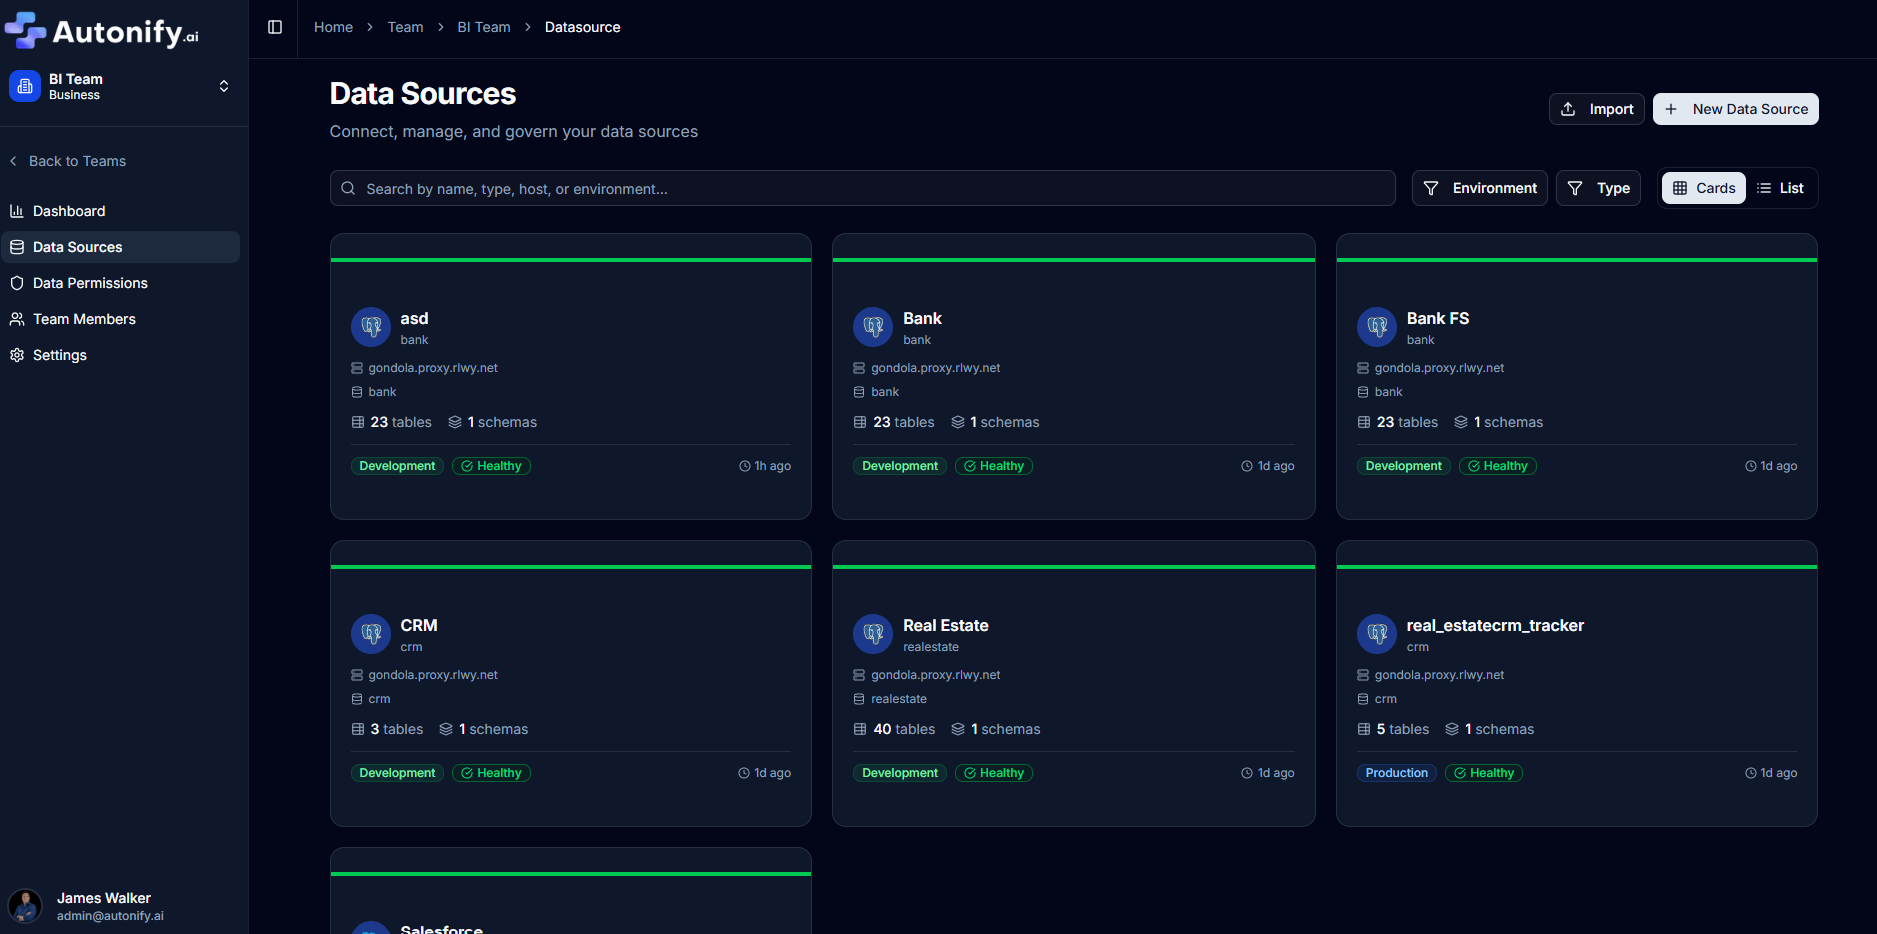
Step 2: Start Data Source Creation
- Click the New Data Source button
- The configuration dialog opens with three steps

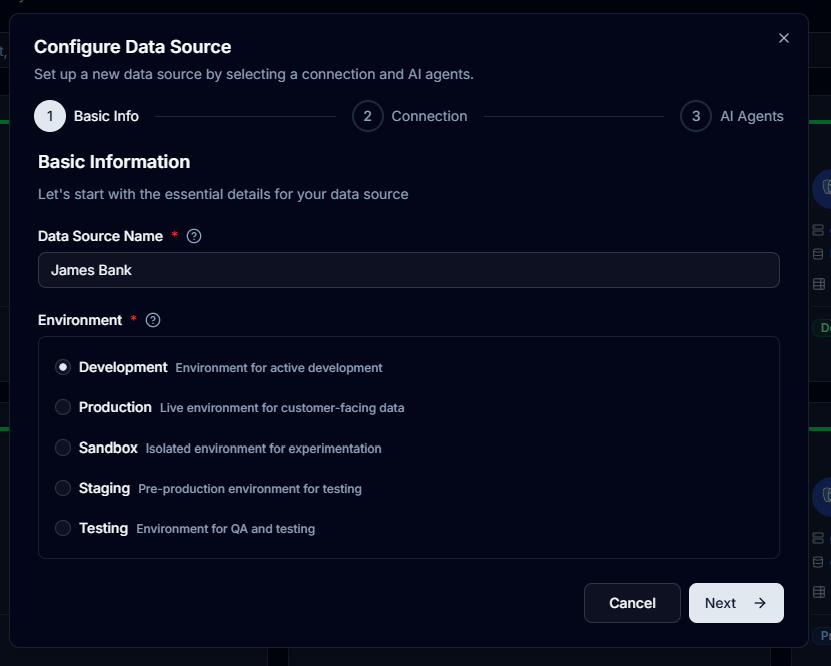
Step 3: Basic Information (Step 1 of 3)
Configure the data source details:
Data Source Name (Required)
- Enter a descriptive name for the data source
- Example: "BankFS" for banking financial services
Environment Selection (Required)
- Select the environment using radio buttons
- Options typically include Development, Staging, Production
- Helps categorise data sources by deployment stage
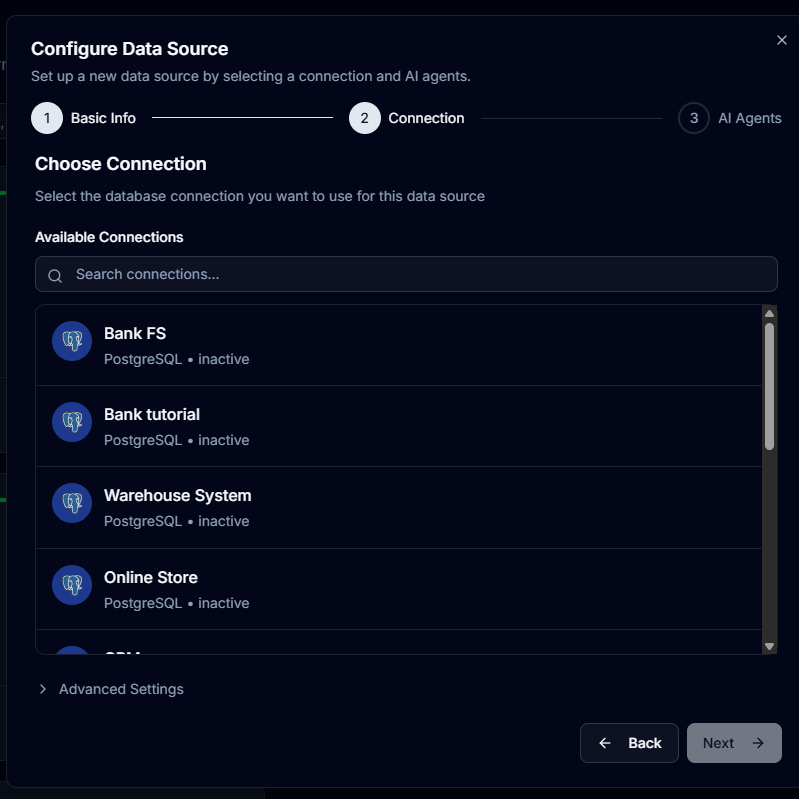
Step 4: Select Connector (Step 2 of 3)
Choose the connector to use:
- Browse available connectors from your connectors list
- Select the appropriate connector for this data source
- Optionally configure "Scan All Databases" option
- Click Next to proceed
Step 5: Configure AI Agents (Step 3 of 3)
Select which agents to run on this data source:
Agent Categories
Agents are organised into categories:
- Essential: Core functionality for data source management
- Data Security & Compliance: Protect sensitive data and ensure compliance
- Documentation & Discovery: Automatically document and describe your data
- Performance & Analytics: Monitor and optimise data performance
Toggle individual agents using checkboxes or use the category switches to select all agents in a category.

Step 6: Create Data Source
- Click Add Data Source button
- The system creates the data source
- Automatic scanning begins immediately
- You're redirected to the data source portal
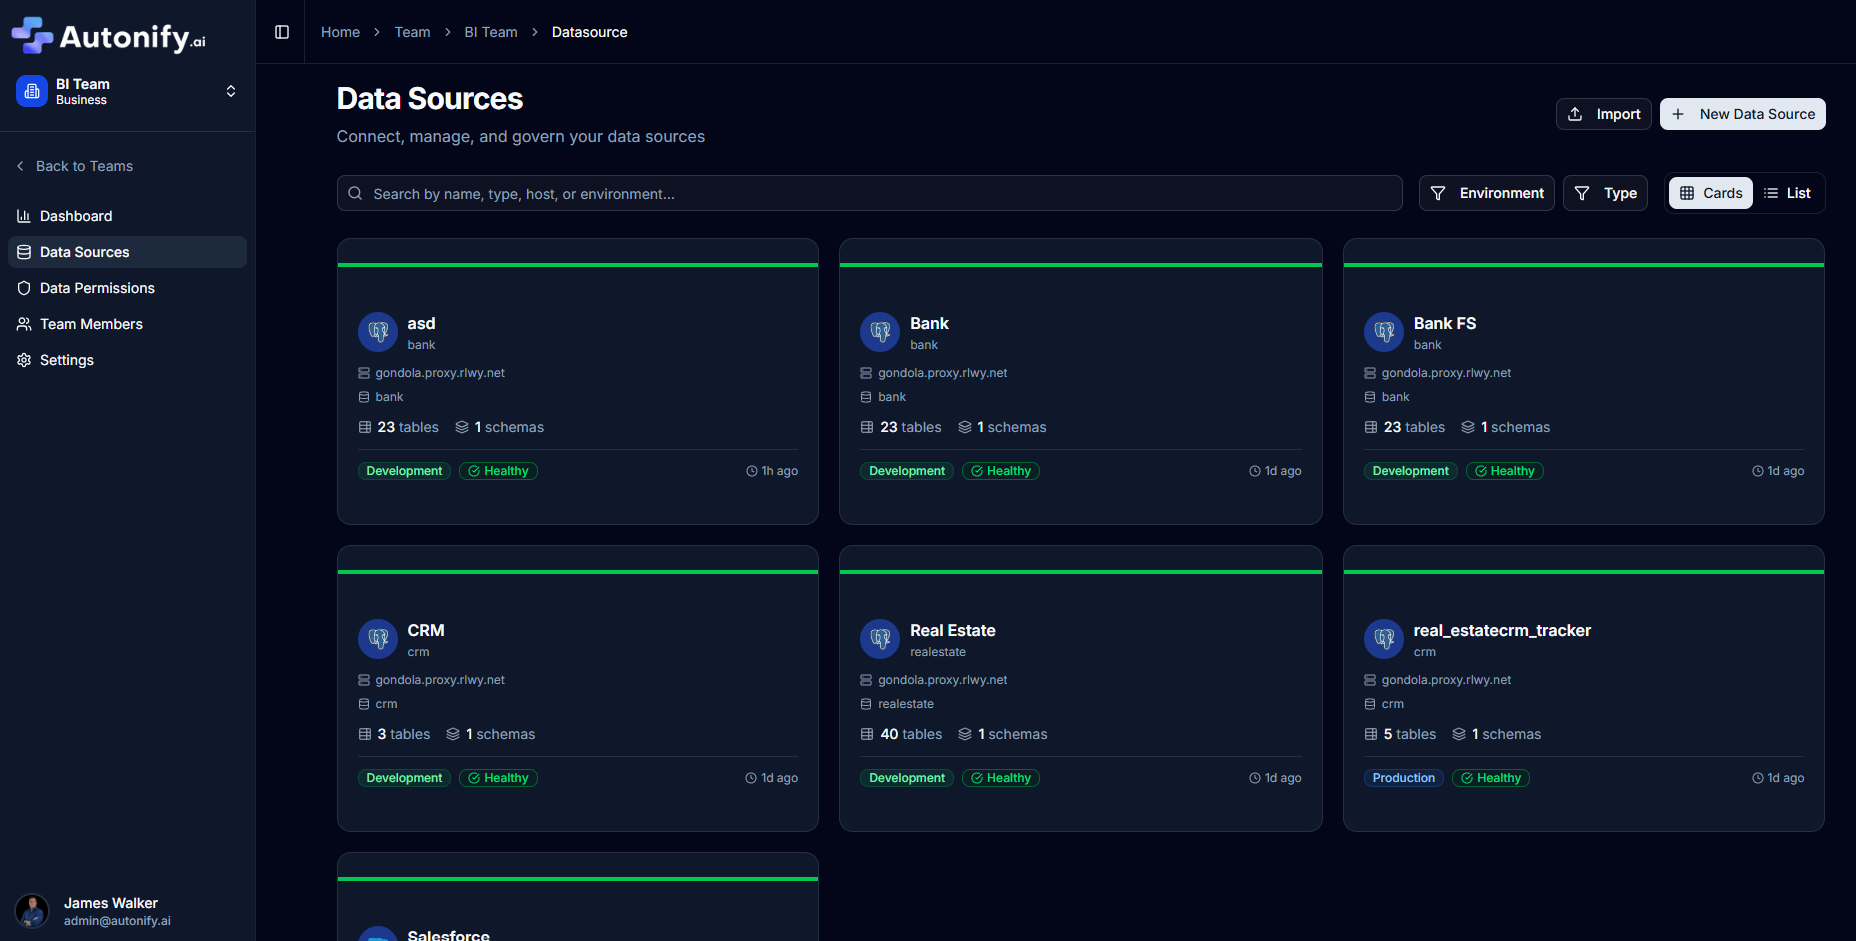
Data Source Overview
After creation, the data source page displays:
Status Information
- Health Status: Shows if the data source is healthy
- Scan Status: Indicates if scanning is in progress
- Table Count: Number of tables discovered
- Schema Count: Number of schemas found
Connection Details
- URL: Database connection URL
- Connector: The underlying connector being used
- Environment: Development, staging, or production
Available Actions
- Open: Access the data source portal
- Settings: Configure data source settings
- Delete: Remove the data source from the team
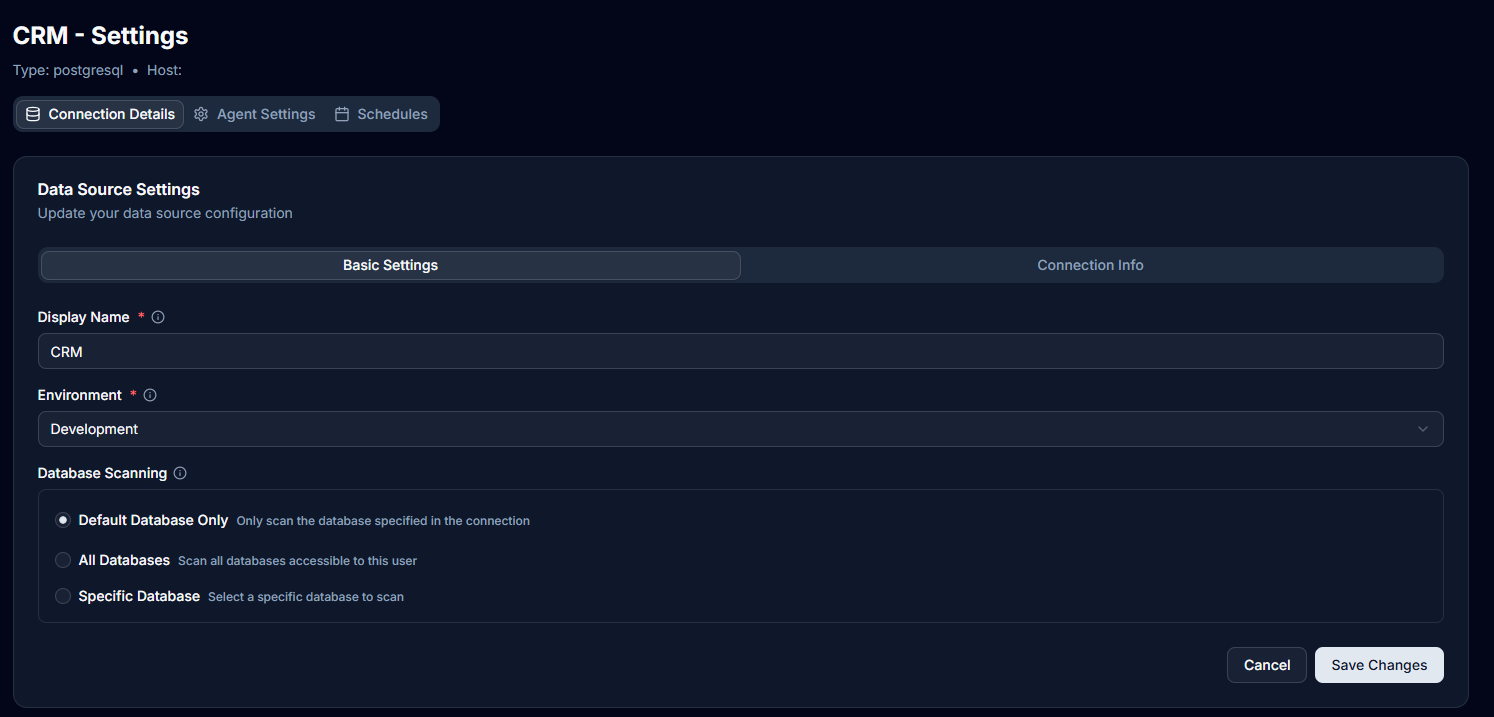
Data Source Settings
Access settings to configure scanning behaviour:
Data Source Information
- Name: Edit the data source name
- Environment: Change the environment classification
Scanning Configuration
Control what gets scanned using radio button selection:
Default Database Only
- Scans only the database specified in the connection
- Fastest option for single database sources
- Selected by default
All Databases
- Scans all databases accessible to this user
- Note: Use cautiously with large instances as scanning time increases
Specific Database
- Enter a specific database name to scan
- Useful when you need a different database than the default
- Text input appears when selected
Managing Existing Data Sources
Viewing Data Sources
- Each team displays its data sources in a list or grid view
- Status indicators show health and scan progress
- Quick stats show table and schema counts
Editing Settings
- Click Settings on a data source card
- Update configuration as needed
- Save changes to apply
Deleting Data Sources
- Click Delete on a data source card
- Confirm the deletion
- The data source is removed from the team
- Note: This doesn't delete the underlying connector
Agent Execution
Once a data source is created:
- Selected agents automatically start running
- Progress is tracked in real-time
- Results appear in the respective agent sections
Viewing Agent Results
- Data Growth: View historical size trends
- Data Profiling: Access completeness and uniqueness metrics
- Semantic Grouping: Browse discovered business concepts
- Data Documentation: Read auto-generated descriptions
Best Practices
Naming Conventions
- Use clear, descriptive names
- Include environment in the name if helpful
- Follow team naming standards
Agent Selection
- Start with essential agents (Growth, Profiling)
- Add specialised agents as needed
- Consider performance impact of running all agents
Scanning Strategy
- Use default database for focused scanning
- Select all databases only when necessary
- Schedule rescans during off-peak hours
Team Organisation
- Group related data sources within teams
- Assign appropriate team members
- Document data source purposes
Monitoring Data Sources
Health Indicators
- Healthy: Connection active, scanning successful
- Warning: Minor issues detected
- Error: Connection failed or scan errors
Scan Status
- Scanning: Discovery in progress
- Completed: Scan finished successfully
- Failed: Scan encountered errors
Metrics to Track
- Table count changes
- Schema modifications
- Agent execution times
- Data quality scores
Troubleshooting
Connection Issues
- Verify the underlying connector is working
- Check network connectivity
- Confirm database permissions
Scanning Problems
- Review database selection settings
- Check for database size limitations
- Verify agent configuration
Agent Failures
- Check agent-specific error messages
- Verify data source permissions
- Review agent logs for details
Next Steps
After setting up your data source: